Zero runtime dependencies
Network visualization
for the web
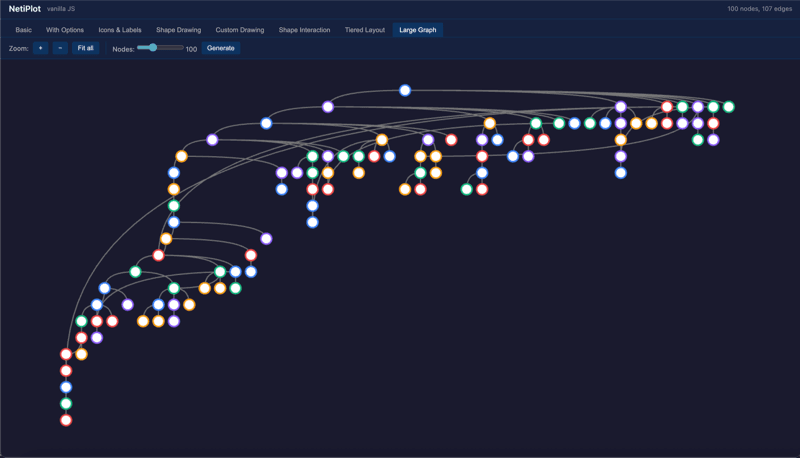
netiPlot renders interactive graph networks on layered HTML5 canvases. Works with React and vanilla JavaScript. No dependencies.
⚡
Canvas-based
Layered HTML5 canvases with a RAF-driven render loop. Handles thousands of nodes without SVG overhead.
🎯
React + Vanilla
One package, two entry points. Use the React component or the imperative class API — your choice.
🔌
Zero dependencies
No D3, no Lodash, no external libraries at runtime. Bring your own layout algorithm or use the built-in hierarchical one.
🎨
Fully customizable
Custom node and shape drawing functions give you direct canvas access. Custom layouters support force simulations and more.
Quick start
Install once, use with React or plain JavaScript.
Install
npm install @jonmodell/netiplot
React
import { NetiPlotReact } from '@jonmodell/netiplot'

const graph = {
  nodes: [
    { id: 'a', label: 'Alpha' },
    { id: 'b', label: 'Beta' },
  ],
  edges: [{ id: 'e1', from: 'a', to: 'b' }],
}

// Container must have an explicit height
<div style={{ width: '100%', height: '600px' }}>
  <NetiPlotReact
    graph={graph}
    options={{ edges: { arrowheads: true } }}
    onMouse={(type, item) => console.log(type, item)}
  />
</div>
Vanilla JS
import { NetiPlot } from '@jonmodell/netiplot/vanilla'

const container = document.getElementById('network')
// Container must have an explicit width & height

const net = new NetiPlot(container, {
  graph: { nodes, edges },
  options: { edges: { arrowheads: true } },
  onMouse: (type, item) => console.log(type, item),
})

// Update the graph later
net.setGraph({ nodes, edges })

// Clean up when done
net.destroy()